Flickr Maps
Introduction
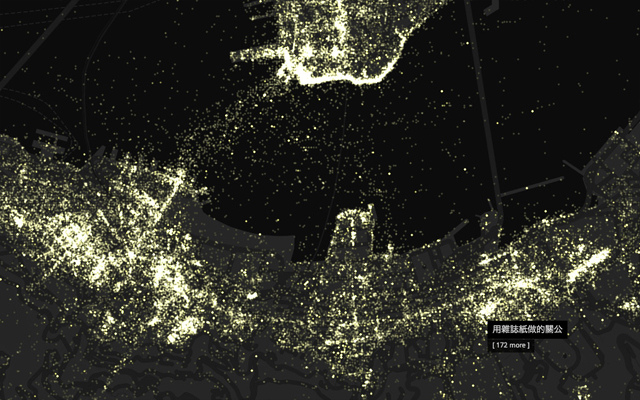
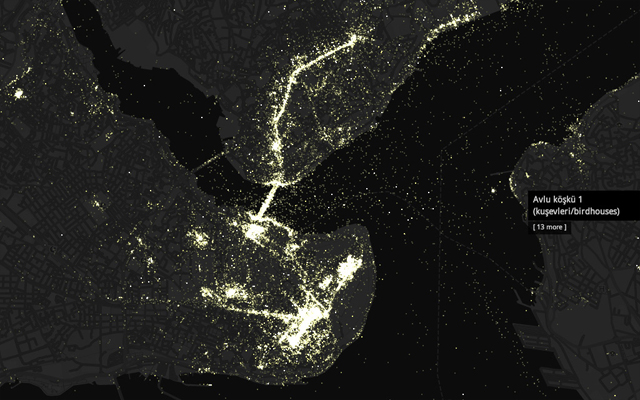
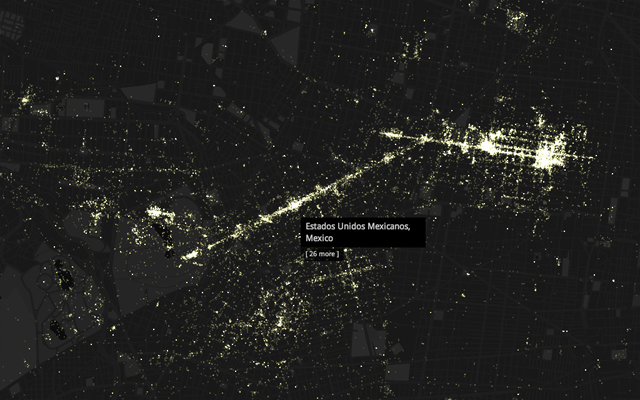
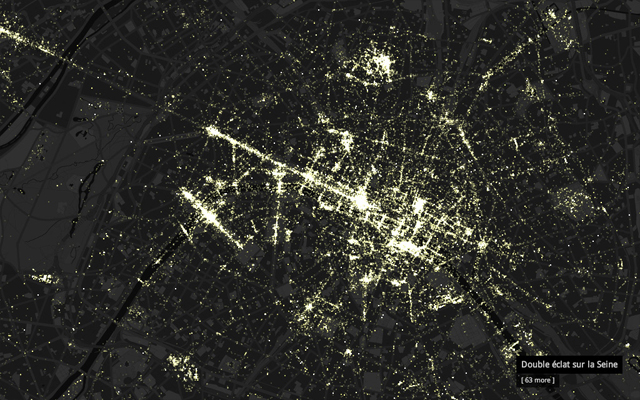
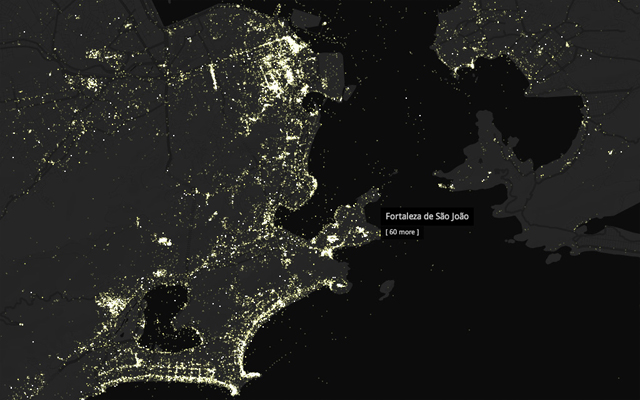
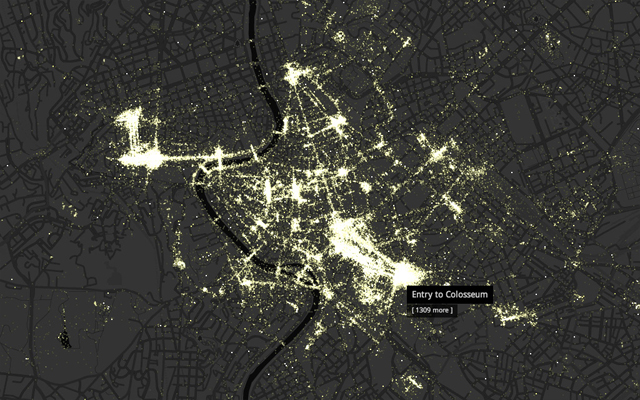
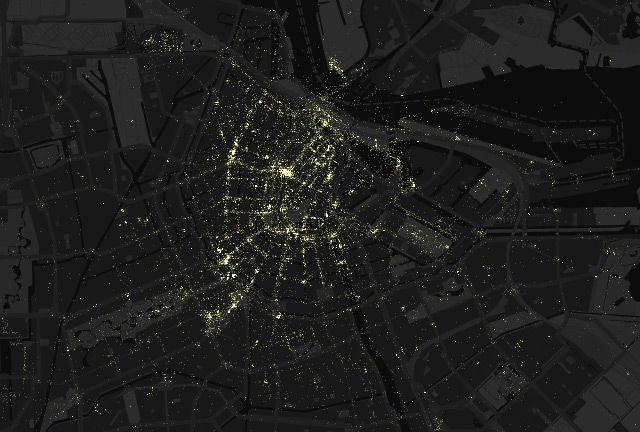
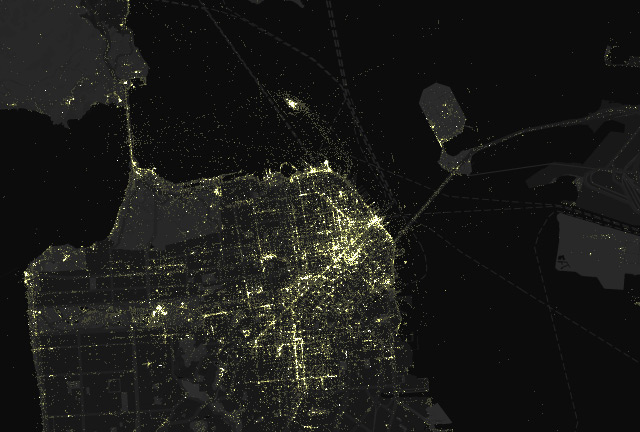
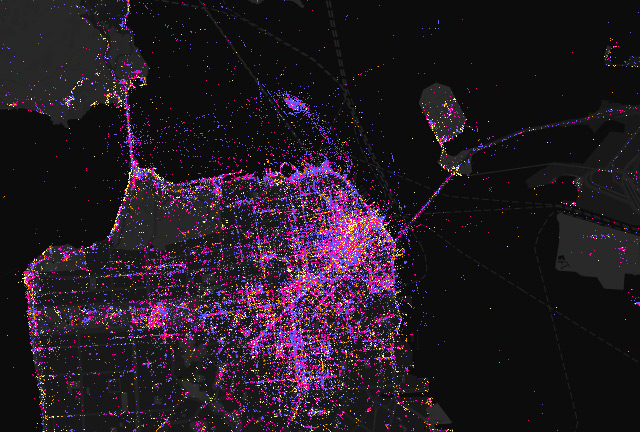
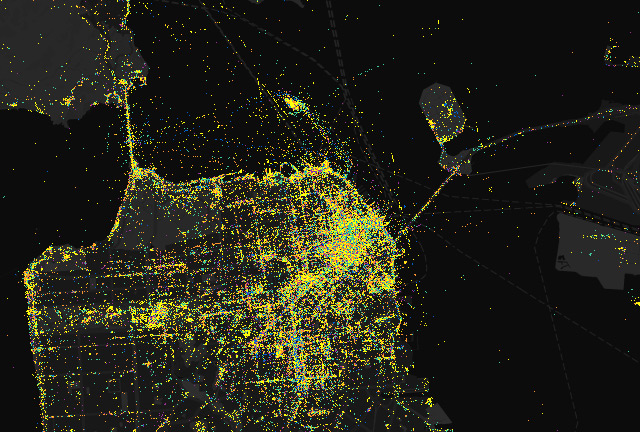
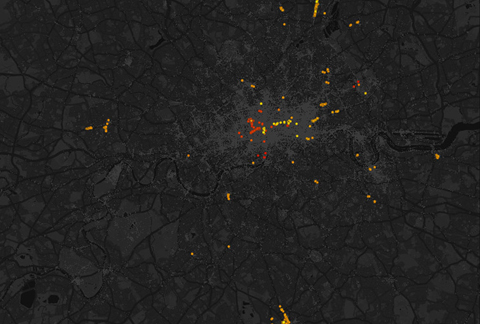
Luminous Cities explores how urban environments are described by the vast archives of image sharing networks. The project employs the last decade of Flickr's geo-coded photos to depict how the myriad of individual contributors form contrasting pictures of the city, and how contemporary events have been documented.
The interactive maps reveal different facets in the photos spatial and temporal content. Animations of the photo data portray both the rhythms of human activity, and the large-scale changes and events that shape its history. Thematic mappings of the photos tags and metadata shed light on political and social concerns. The traces of protests, riots, and occupations appear alongside the background hum of tourism and sightseeing.
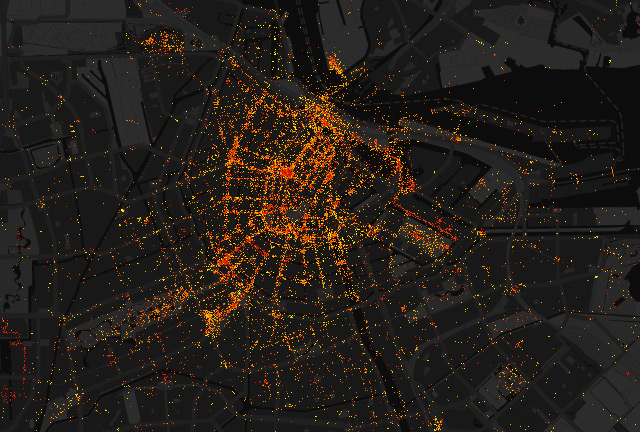
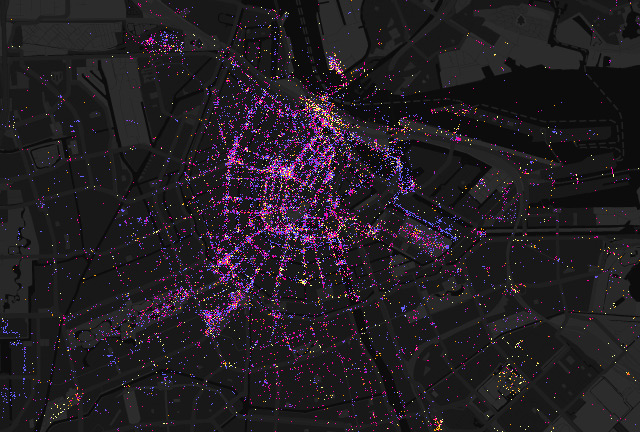
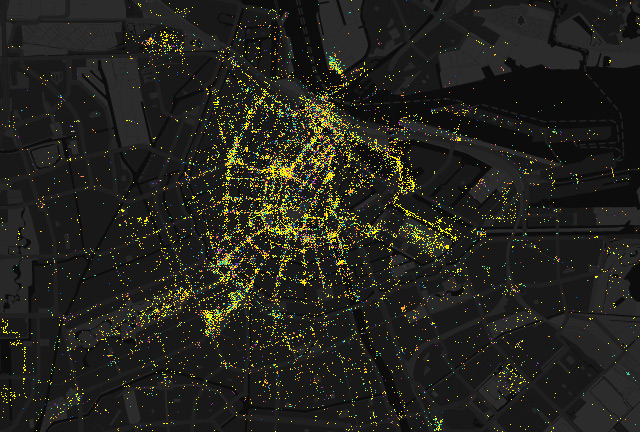
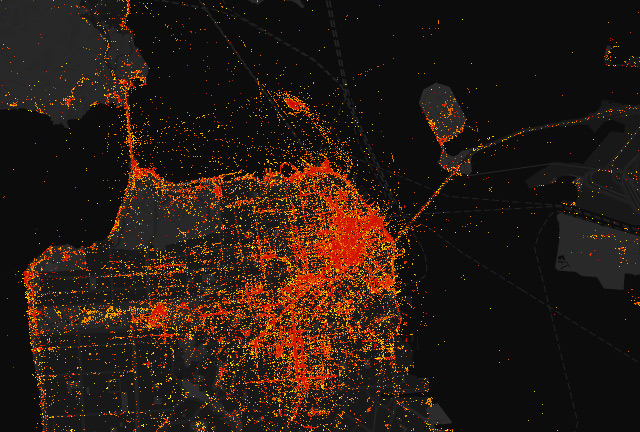
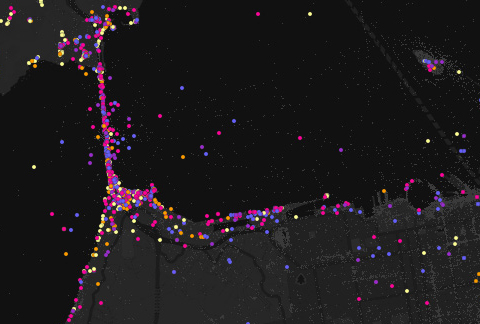
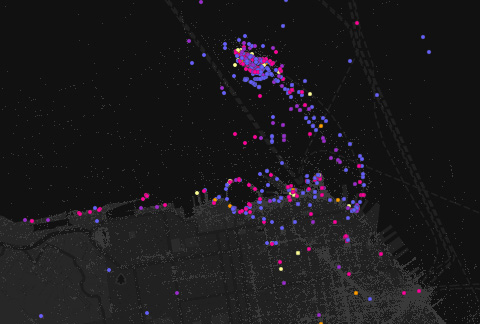
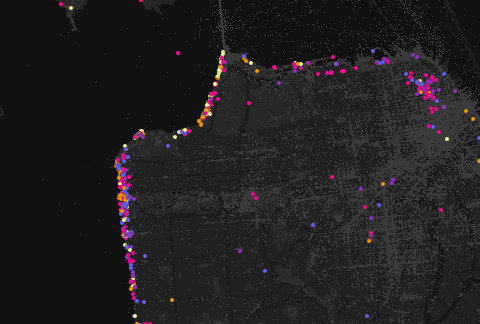
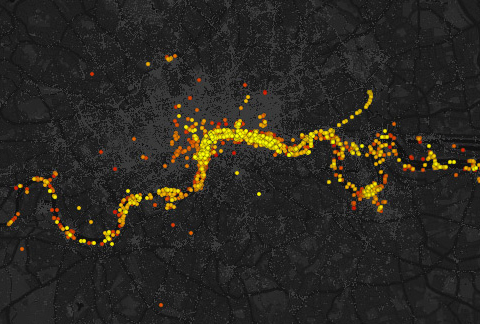
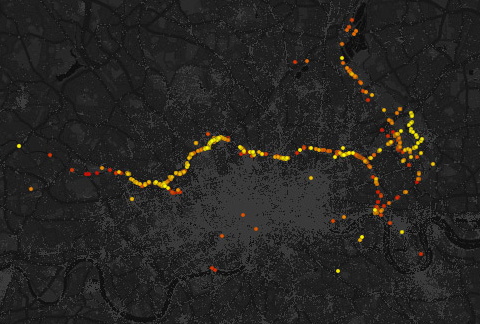
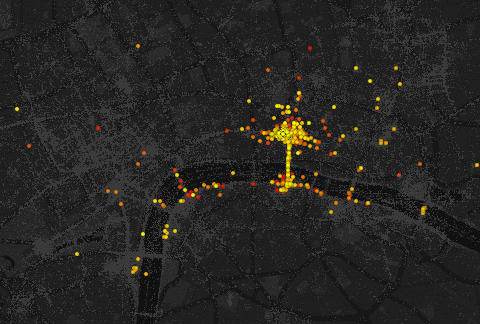
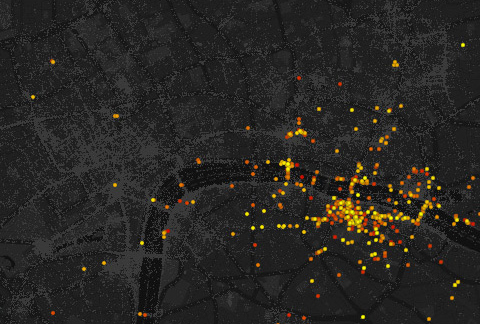
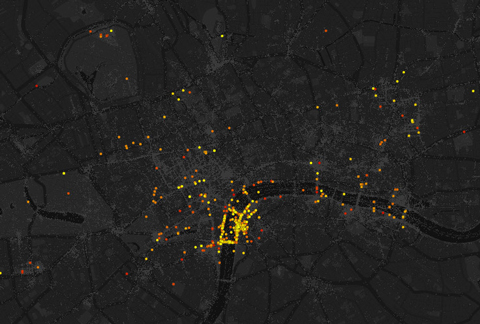
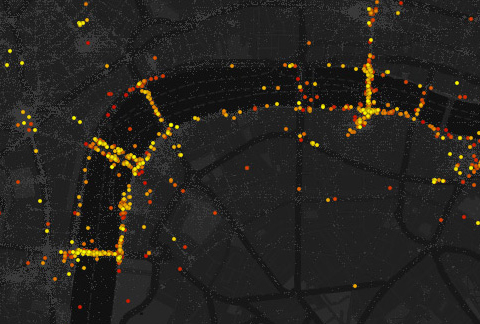
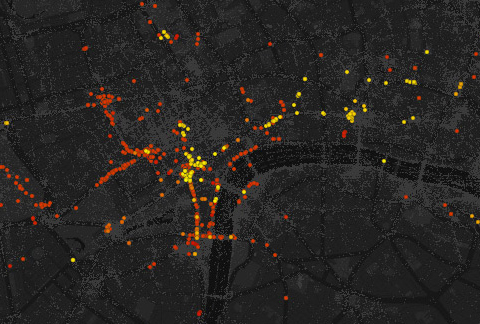
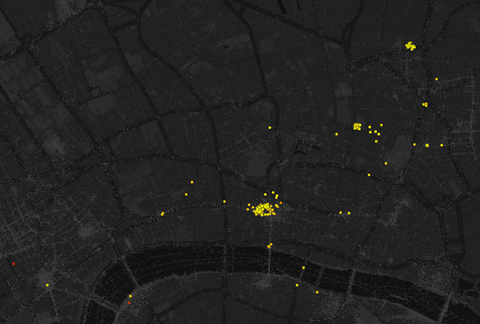
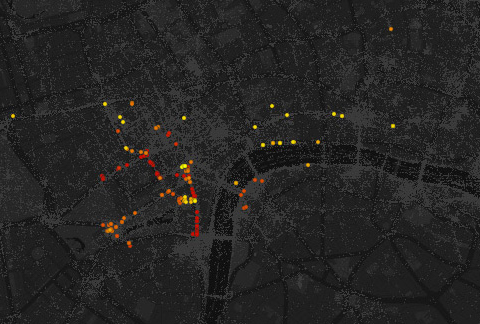
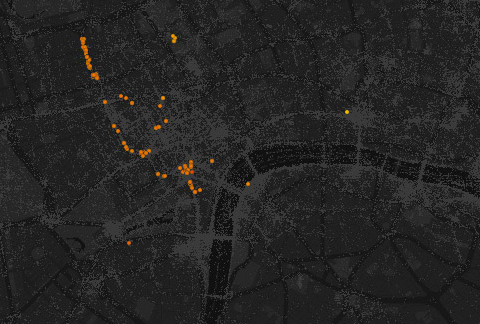
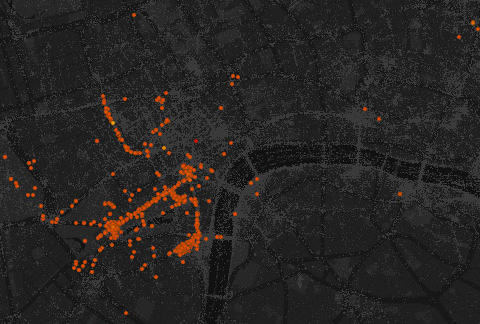
Example Map Images
A cross-section of world's cities have been selected as case studies. Flickr is more widely used in some countries than others, therefore the number of geo-coded photos doesn't reflect the population size of a city. Data has been collected for the largest Megacities by population, so that it’s possible to compare the urban activity of the Flickr community in different parts of the world. We also have sets for the Americas and Europe where Flickr use is more concentrated.
Timeline
The Flickr API has been used to generate temporal city level maps. Like the archaeological record, these traces and mappings are never complete and always highly contingent:
- Who records? Flickr’s user base has demographic biases.
- When are photographs taken, in response to which events?
- Where are photos taken, which locations are popular or which not?
- What is left behind - what is being photographed?
- What 'survives'? The geo-referenced photos are only a subset of those originating from a particular city.
To explore some of these questions the timeline interface enables us to select and see different time ranges and 'play' the sequence of locations, visualising the order in which the photos are taken. The rhythms of activity may be as a result of an individual or group social activity, and are mostly played out in public space - the accretion and accumulation of photographic data renders the grid iron of the city street layout visible in the popular centres of cities.
Map Metrics
This release allows us to explore the geography of the data further by selecting different metrics from the 'map' dropdown.
- Density
- The density view allows us to see more easily where images are clustered on top of each other, which would not otherwise be visible as individual points.
- Date Taken
- When this metric is selected the points are coloured according to date, allowing us to see which places are photographed at similar times
- View Count
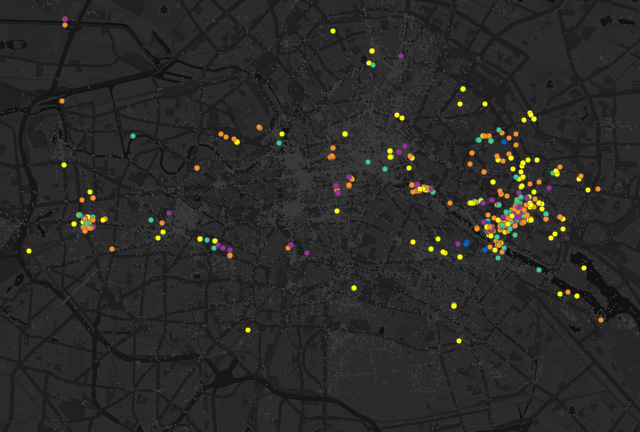
- This metric is divided into a continuous range of five sections (0 - 4, 5 - 9, 10 - 49, 50 - 99, 100+) These numbers represent the view count up to the end of 2012
- Time of Day
- We are using the photo timestamp to display when photos are taken and have broken the day into five sections (0 - 5, 6 - 11, 12 - 16, 17 - 20, 21 - 23). This metric is dependent on the accuracy of the timestamp from the camera, so the results are not always accurate - some photos that have a timestamp for a time in the middle of the night have clearly been taken in the day.
Users
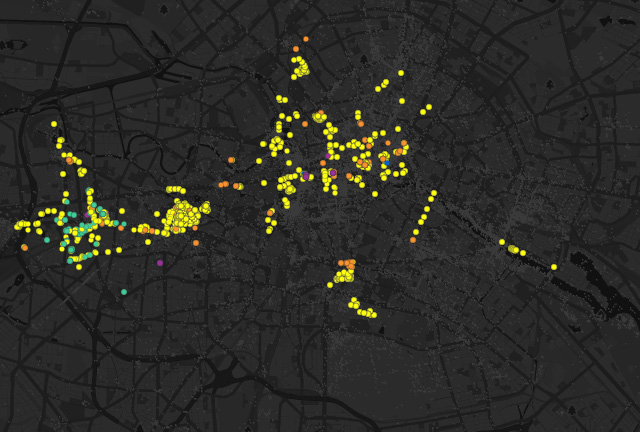
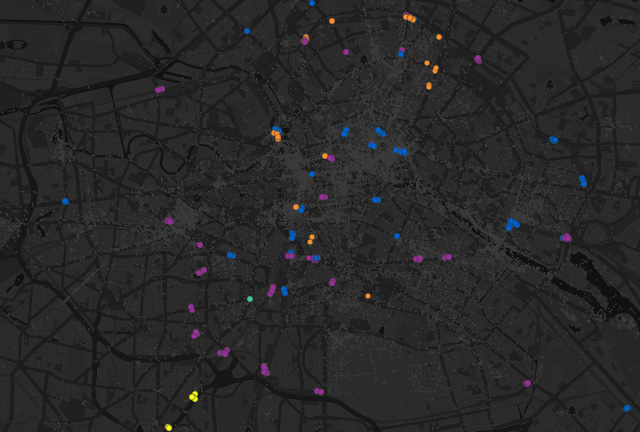
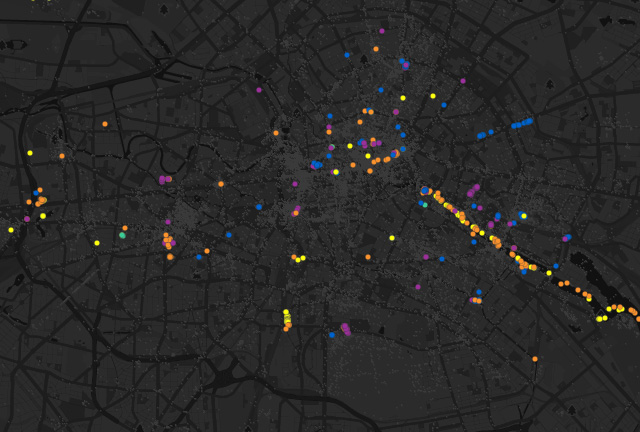
In a Flickr users version of the project, the top 1000 users by numbers of uploaded photos are displayed. This gives us a further way of viewing locations according to who has taken and uploaded a photo. The different spatial configurations of user photo locations very quickly highlight the different usage patterns of how individuals see and respond to the city. The selection of images below are from Berlin in 2012, the metric displayed is time of the day, which gives further insight into when users are active.
